Infographics have become one of the most popular visual content marketing tools. The effectiveness is incredible in providing boring statistics into a visual display to get the readers to learn all about anything and everything FAST. People don’t like to read charts and graphs. It can get rather confusing and that’s where infographics have become a handy tool to distribute facts in a visually appealing way.

I’ve wanted to create an infographic for some time now and I knew if I could get some great stats I could come up with a visually appealing infographic to make the stats user-friendly.
The question I had was, “Would Canva be the tool to create an awesome infographic?” Canva is an amazing tool and has lots of icons that can be used. They do have an excellent article on infographics here through their Design School. What I noticed was that their examples were not the typical narrow in length graphic. They were more rectangular in shape.
Why would I want to create an infographic?
Infographics are shared like crazy on Pinterest therefore the graphic should meet the specifications. I’ve noticed the longer the length of the infographic, the better on Pinterest to get re-pinned.
Find an article that would appeal to your audience or tribe.
I found an article from HubSpot all about the stats on visual content marketing from the research from 2014. THESE were the stats I’ve been waiting for to create an infographic. PERFECT, right? Well the article has 17 stats.
How can I get all those stats on the infographic?
Infographic Tools & Options
I did some research on other FREE infographic tools besides Canva. There are quite a few however the sites that were the most user-friendly were: Venngage, Piktochart and Easel.ly. All three of these sites offer templates, icons and premium packages. The premium packages for Piktochart and Venngage would allow you to remove their watermark on the final downloadable image and provide more icons/images. Easel.ly will let you create and download without a watermark and the templates have many icons that can be used and more icons are available in their library.
Here’s what I created in Easel.ly:
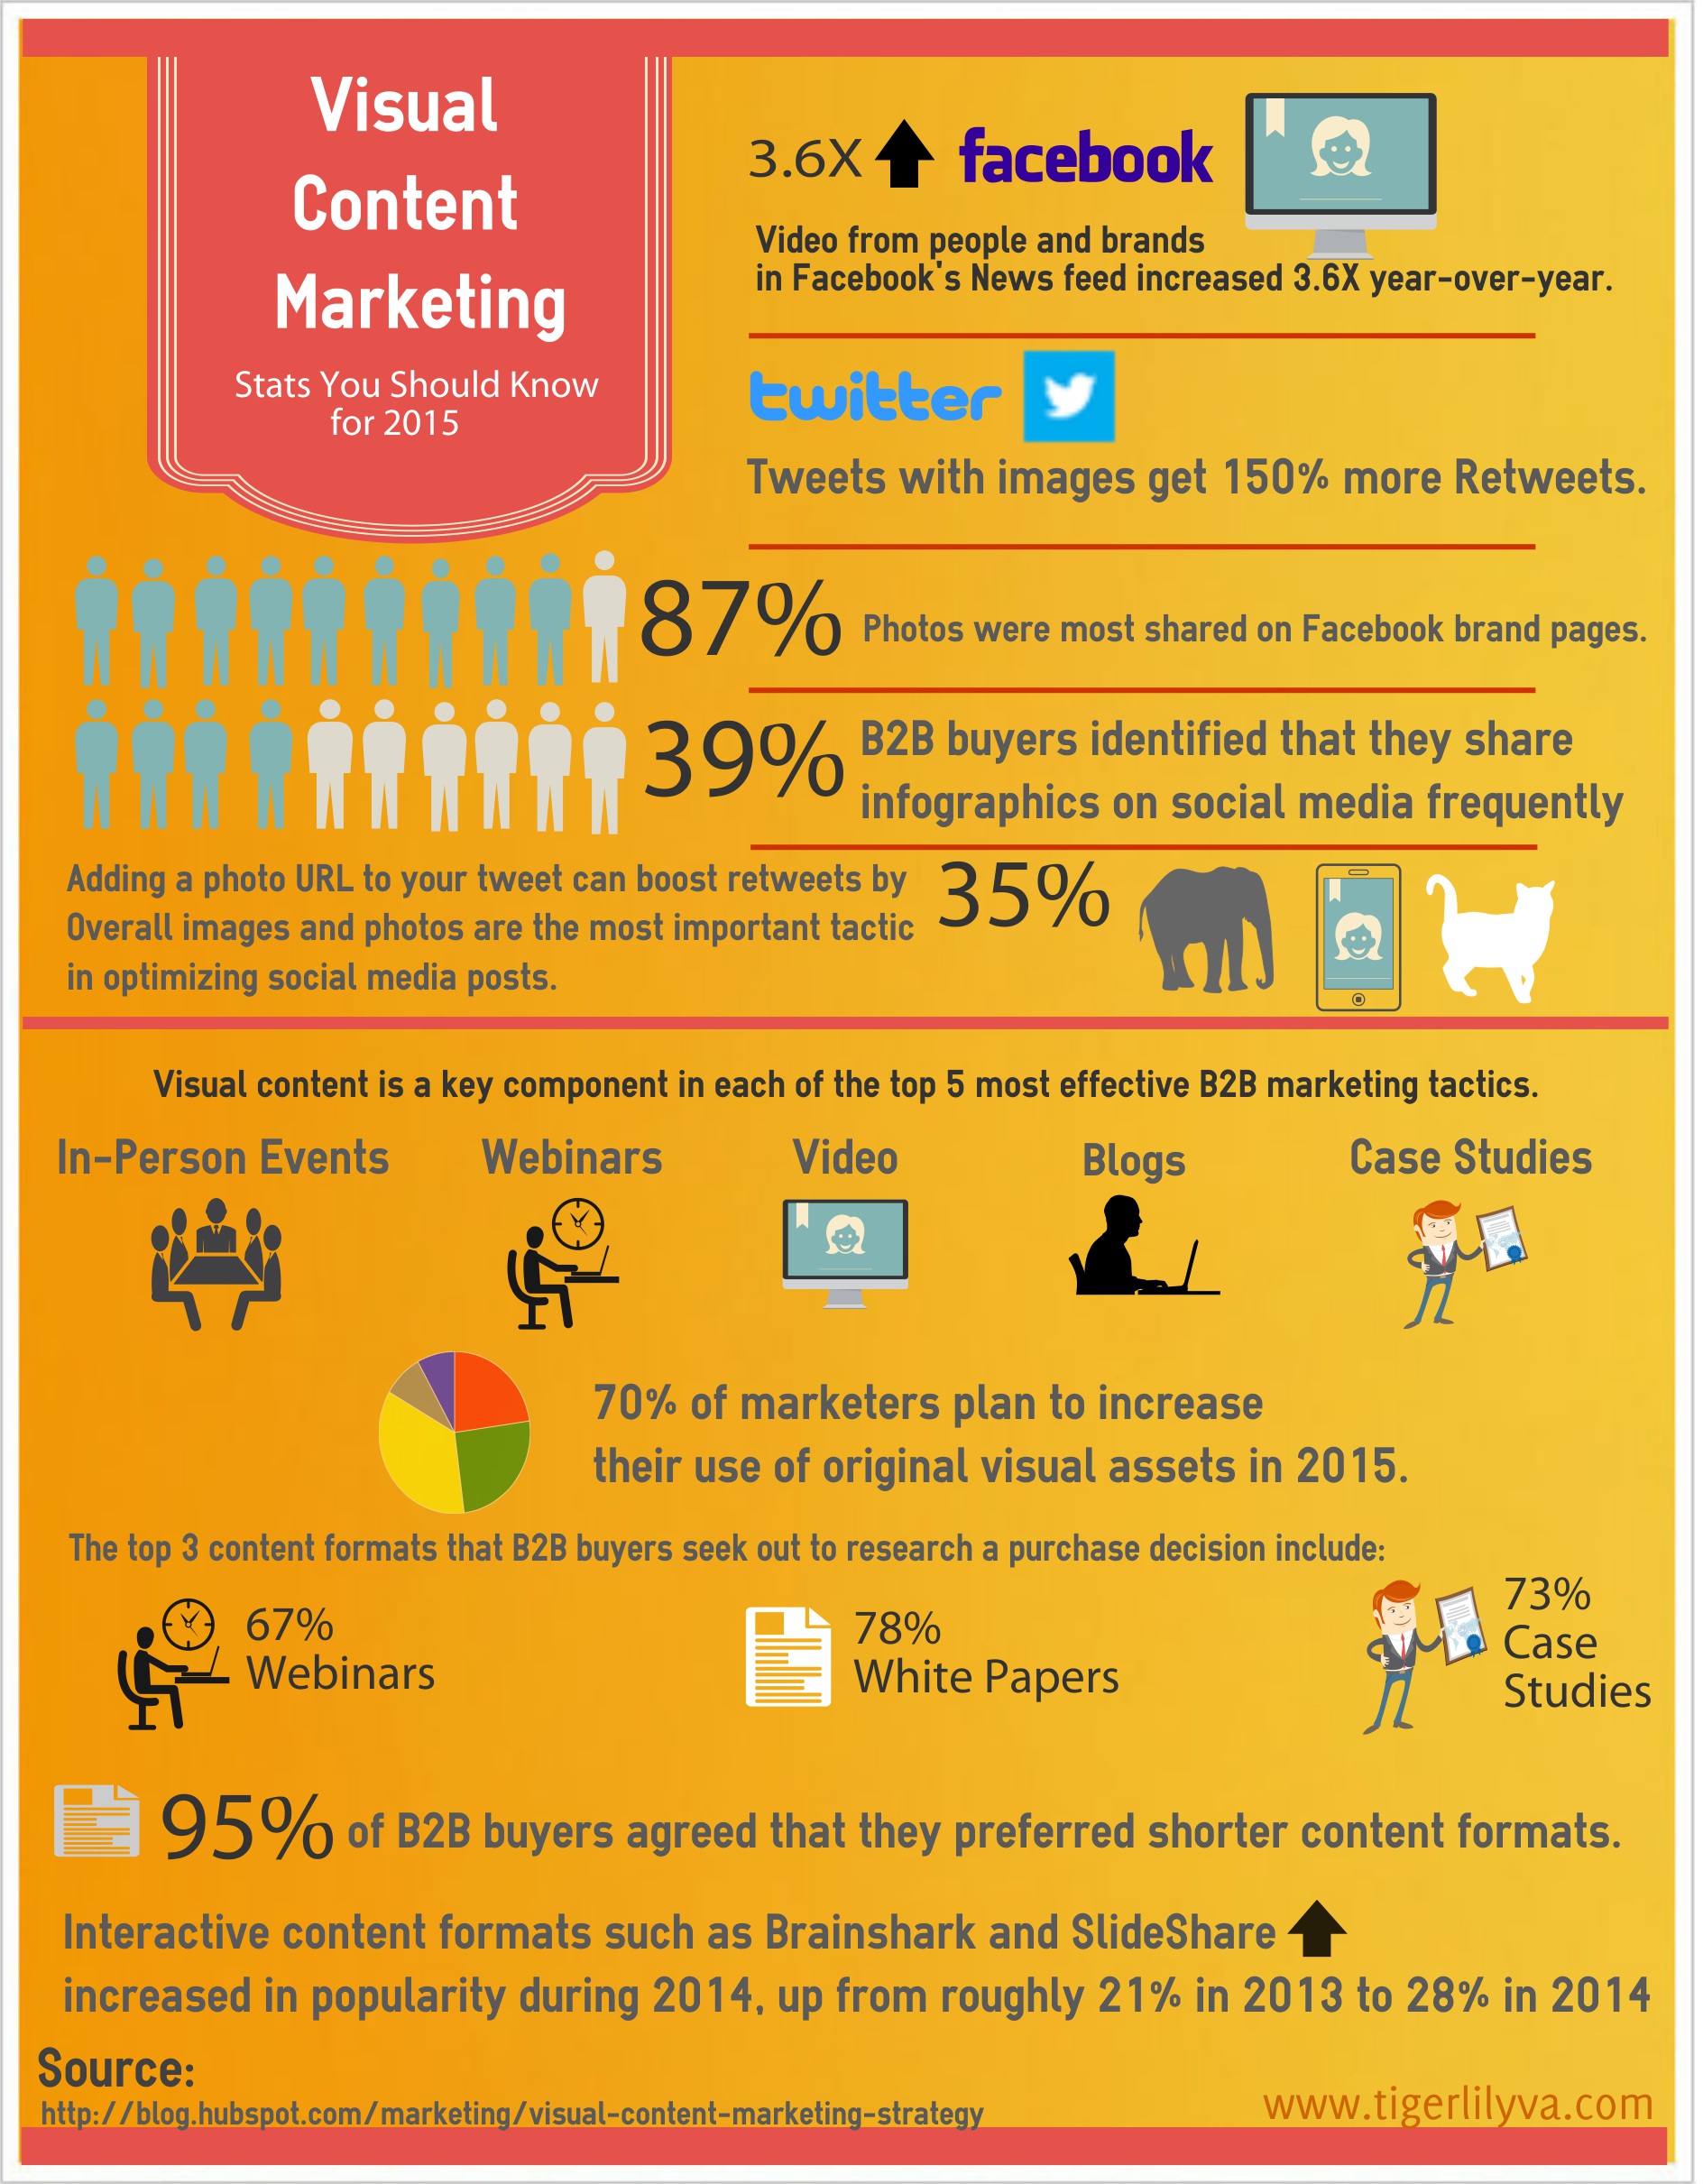
You can embed this infographic with the code here.
Not bad, I could have chosen a different template that was a bit longer in length but this particular template had the icons I needed. You can also upload any images that you’d like. Unfortunately when I gave it a try it stalled.
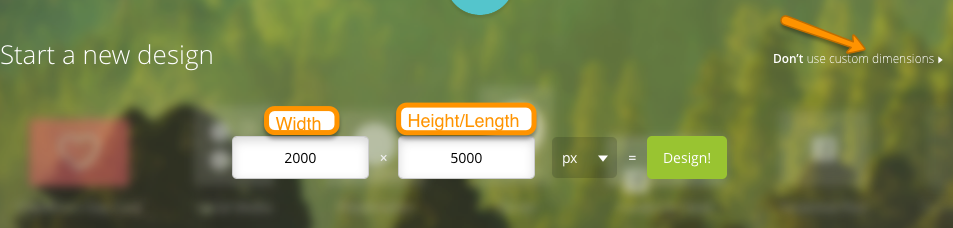
Of course I tried Canva and I found out that the longest length you can use on Custom Dimensions is 5000 pixels.
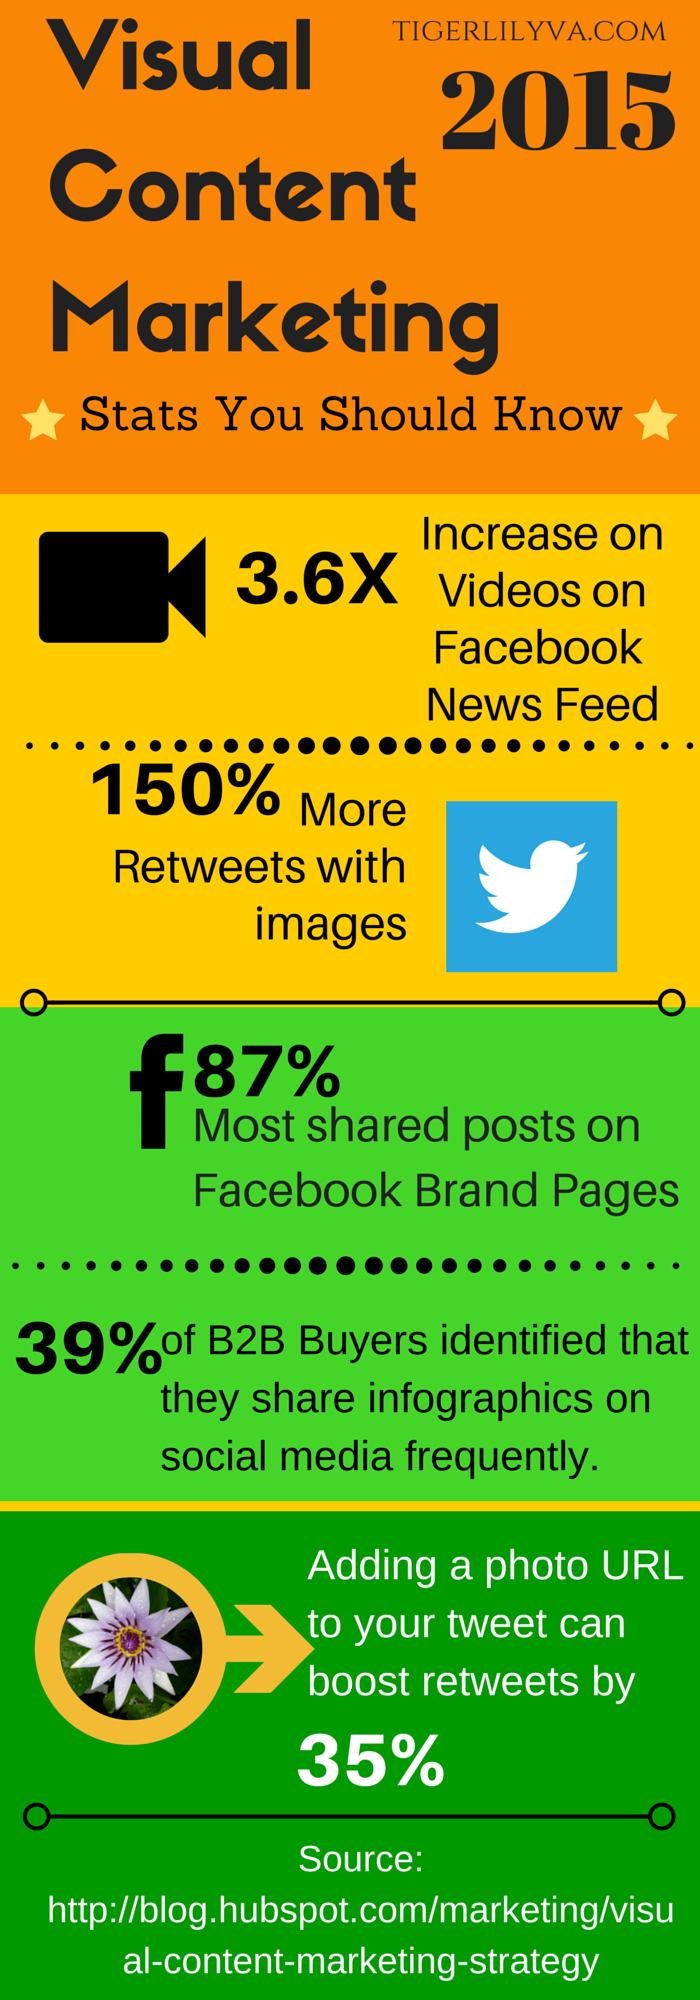
It was a bit awkward using Canva to design an infographic and I think it was because I had SO many stats to fit. I actually couldn’t place a lot of information on it, only about 4-5 stats. The preview became teeny tiny and even with zooming in. I could definitely use Canva for infographics that are short and sweet with just a handful of stats. Any more than that it could look messy and not visually appealing. Take a look at what I put together in Canva below.
An Exploration & Discovery with Free Infographic Tools
My Exploration
Although I found some interesting methods to create infographics it was not as fun as I thought it would be. Haha
My Discovery
I will probably never make another infographic. Why? I believe the best use of displaying stats is through SlideShare.
Now that’s what I call FUN! AND I get to do it all in Canva. ❤
If you would like to know more about creating SlideShare presentations with Canva, check out this post.
Your Preference
Do you like creating infographics? – TWEET THIS
How about SlideShare presentations?
Let me know in the comments and please share the infographics and/or SlideShare if you find it helpful.
Take care,
Lillian De Jesus

Great post Lillian. Even though I’m a very visual person I must admit I have mixed feelings about infographics and I could never see how to use them effectively in my field, but I’ve come up with a few ideas and your post has inspired me to play around with them and see what I come up with. Thanks!
Hi Marquita,
Glad you liked the post and has inspired you! I’ll be sticking with SlideShare from now on. LOL
Take care,
Lillian
Thanks Joan for sharing!
Hi Lillian ,Canva ,is a great tool and you explain
everything very good . I do not like Infographic
very much and think slide share I like better.
But you did a good job in creating yours here.
Thanks for your great teaching
Erika
Reblogged this on ErikaBeyk.
Great article it will help in some book advertising I am considering. Thanks for the info.
That’s great to hear that it’s helpful to you Lawrence.
Thanks for stopping by,
Lillian
Hi Lillian, Thanks so much for sharing this great infographic information. I haven’t really worked at creating any so far but it’s good to know where to go and get the information from (You) when I am ready.
Hi Lillian, I’m new at infographics, but I do use Canva and love it.
Thanks so much for sharing this. It is something I’m currently trying to work on. I also like the idea of slide shares.
-Donna
Hi Donna,
Canva is great for very short info graphics but if you’re looking for the very long infographic then definitely try the Piktochart or Easel.ly. Very easy to do with lots of options! I LOVE SlideShare.
Take care,
Lillian